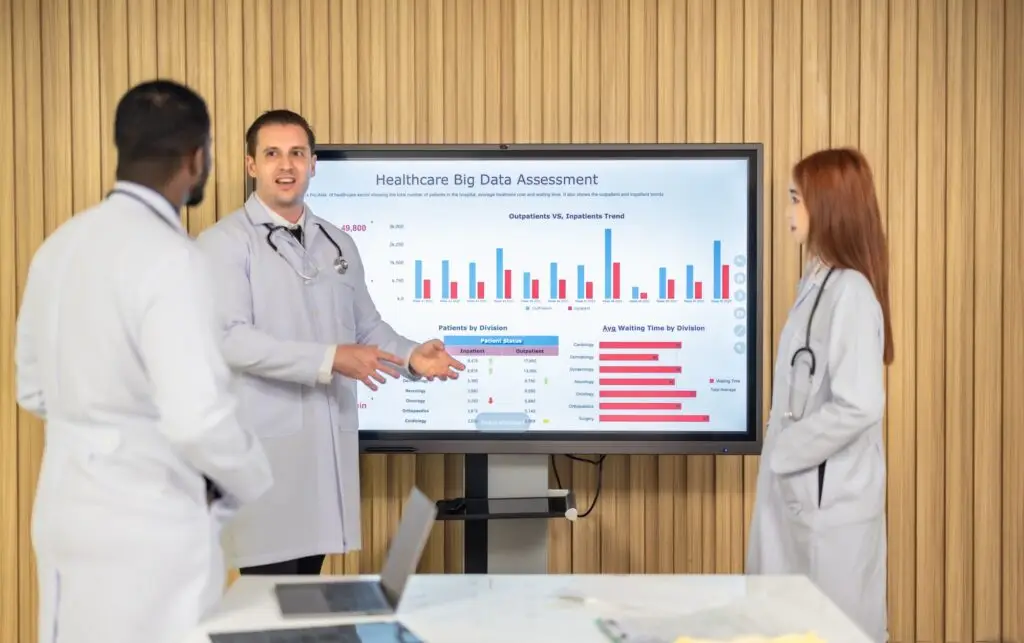
The Importance of Data Visualization and Reporting Tools in Clinical Research
Clinical research requires the collection, processing, and analysis of complex, multidimensional data. In these processes, effectively visualizing and making data understandable is critical for making informed decisions. Data visualization and reporting tools provide research managers with better insights, allowing processes to be optimized and budget management to be conducted more efficiently. Omega Pay utilizes advanced tools like Power BI to visualize clinical research data and make projections in budget management, ensuring that processes move forward in a more transparent and efficient manner.
The volume of data generated during clinical research is substantial, and manually processing and analyzing this data is both time-consuming and prone to errors. In critical areas like budget management, inaccurate analyses can lead to significant financial losses. Data visualization tools like Power BI eliminate these issues by turning complex data into meaningful insights through graphs, tables, and interactive reports. Omega Pay’s integration with these tools provides managers with important advantages in making strategic decisions.
Data visualization allows clinical research teams to better understand all processes. For example, financial data such as payments to volunteers, budgets distributed to researchers, and operational expenses become easier to understand when presented visually. This helps teams develop a clearer vision of how to manage the budget. Omega Pay’s visualization solutions, using Power BI, enable research centers to be more effective in budget management.
Projection goes beyond data visualization by allowing the forecasting of potential future scenarios and planning the budget accordingly. Omega Pay uses Power BI to develop predictions based on past data, enabling research centers to allocate their budgets more accurately. For example, future expenditures can be estimated based on past payment trends and the number of volunteers, allowing for the development of appropriate strategies.
Reporting tools provide research centers with regularly updated and detailed financial information. These reports allow the tracking of payments to volunteers and researchers, operational costs, and overall budget performance. Omega Pay’s reporting tools enable users to easily analyze data and ensure transparency in financial processes. Additionally, these reports make it easier to prepare the necessary information to be submitted to regulatory authorities.
Data visualization and reporting are used not only to improve financial processes but also to enhance the understanding of research outcomes. For example, information such as volunteer demographic distribution, participation continuity, or the performance of research centers in different regions can be more effectively evaluated when presented in a visual format. This helps research managers optimize processes.
Omega Pay’s visualization tools are also built on a strong infrastructure in terms of data security. Developed in compliance with regulations such as GDPR, KVKK, and HIPAA, the system securely processes and visualizes users’ data. This not only ensures legal compliance but also enhances data security for research centers and strengthens participants’ trust.
Interactive dashboards are another powerful aspect of data visualization. Omega Pay, through its Power BI dashboards, allows users to examine and analyze data in detail. These dashboards make it easier for research managers to evaluate different scenarios and make strategic decisions. For example, you can instantly obtain information on which phase of a research project requires more budget or which region has high costs.
Another advantage of visualization tools is the enhancement of inter-team collaboration. Omega Pay’s Power BI integration allows research teams to work on the same data and easily share information. This facilitates more effective communication among team members and better coordination of processes. A shared visualization platform helps teams work more cohesively towards the same goal.
As a success story, we can examine how Omega Pay optimized budget management in a clinical trial by using data visualization and reporting tools. Errors and time losses encountered with manual methods were completely eliminated thanks to Omega Pay’s digital infrastructure. The research center was able to manage the budget more efficiently and significantly reduce costs using interactive dashboards and detailed reports.
In conclusion, data visualization and reporting tools enable clinical research to be conducted more effectively and transparently. Omega Pay, with solutions using advanced tools like Power BI, provides research centers with significant ease in budget management, projections, and operational processes. Contact us to optimize your clinical research processes and ensure more effective budget management.

